NDVI: What Vegetation Tells Us From Space
Reading time: about 2 minutes
One of the most common and important indices in remote sensing for agriculture is NDVI - the Normalized Difference Vegetation Index. It's a measure that allows us to assess the state of vegetation using satellite imagery.
How does it work?
Healthy vegetation absorbs a large portion of red light for photosynthesis and reflects a high proportion of near-infrared (NIR) radiation. NDVI combines these two spectral bands to produce a value between -1 and 1. The higher the value, the greener, denser, and more active the vegetation typically is.
What can we learn from NDVI?
- Identify differences in growth intensity and biomass
- Detect weak or anomalous areas within a plot
- Spot a decline in plant development over the course of the season
- Compare between plots, regions, and different imaging dates
- Focus field visits and inspections on areas where anomalies were detected
It's important to remember: NDVI points to variability and the state of vegetation, but not necessarily to the cause. A low value can result from, for example, water or fertilizer shortage, disease, pests, soil issues, or low plant density. That's why it should be combined with additional information and agronomic knowledge of the plot.
How NDVI comes to life in Veleres
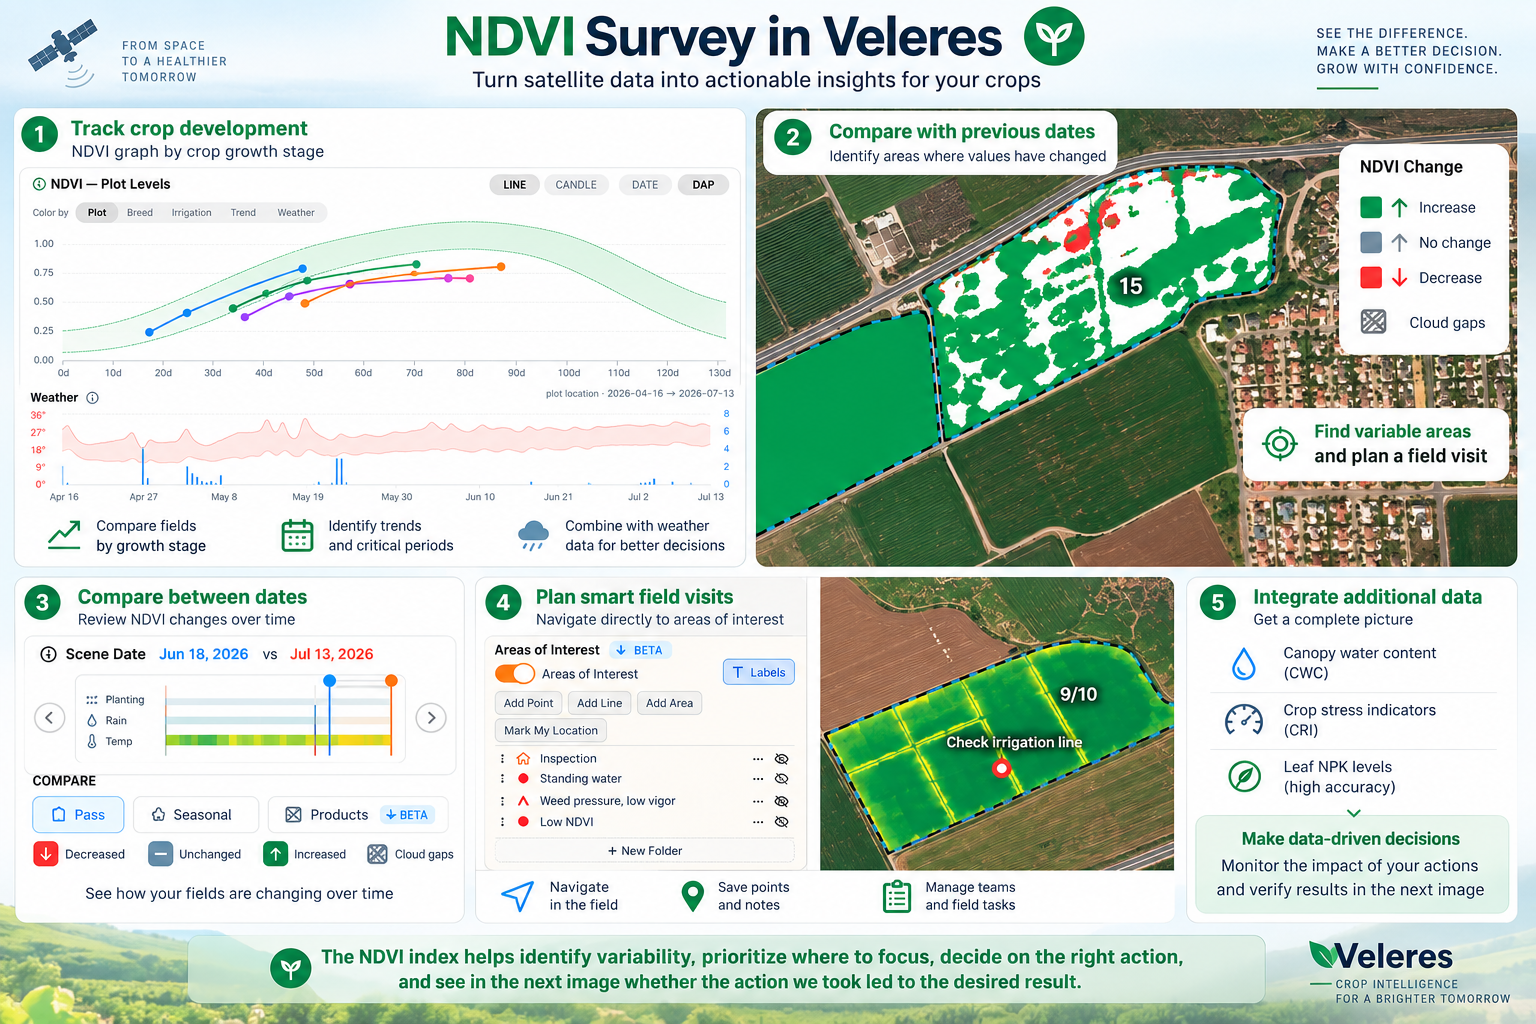
At Veleres, we turn NDVI from a color map into a working tool throughout the season:
- Continuous monitoring: satellite tracking of plots throughout the entire growing season.
- Variability detection: displaying within-plot variability and pinpointing anomalous areas.
- Season-long tracking: showing NDVI development in a graph at the plot level or per irrigation zone.
- Comparison by crop age: normalizing the timeline by plant age instead of satellite imaging date, enabling comparison between plots sown or planted at different times, in line with accepted practice in the literature and research.
- Comparison across plots and dates: identifying trends and changes over time, both within the same plot and between different plots.
- Field visit planning: marking areas of interest and efficiently planning field visits.
- Field navigation: guiding field staff directly to areas requiring inspection via navigation mode.
- Integration with additional indices: combining NDVI with plant water indices, stress indicators, and leaf NPK level estimates - which we'll expand on in upcoming posts in this series.
This is how NDVI evolves from a raw satellite metric into a tool within a decision-making system - helping to understand where to focus, what has changed, and when a field inspection or action is needed, as well as to follow up afterward and check whether the actions taken actually delivered the desired result.